Big Data Month: How Government Can Move Beyond Being Data Rich, But Information Poor

Data is everywhere in government but turning that data into actionable information and insights remains a persistent problem. “We are data rich and information poor,” said Shelley Metzenbaum, a former associate director for performance and personnel management at the Office of Management and Budget (OMB) at a recent IBM Center for The Business of Government session on “Envision Government in 2040”.
The group focused on how increased access to data and analytics could change how the public sector delivers on its missions. GovExec reports on the findings – and we sprinkle in some examples:
Data is moving to the edge – The internal use of data is shifting from central offices to front-line workers. From child welfare caseworkers seeking on-the-go access to information about foster children/families in their jurisdiction to public works departments providing real-time data to waste management fleets about routes and assignments. This is already happening in the private sector and now government agencies are seeking to capitalize.
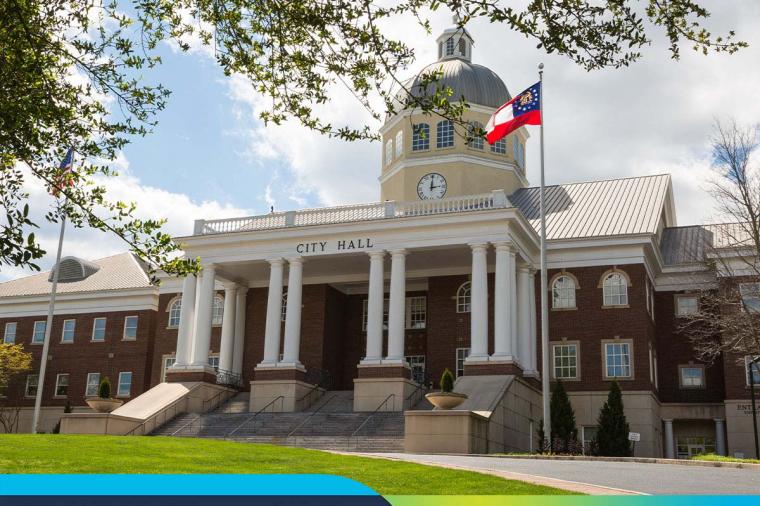
The shift in data collection – Governments are collecting more granular data and more aggregated, integrated, and layered data from multiple sources. GovExec cites an example from my hometown, the Town of Cary, NC, which provides citizens with access to 38 different data sources including restaurant inspection data, public school grading data, fire incidents, crime mapping, and more via a single portal.
A shift to providing near-real-time data – If you’re a case worker out in the field then you need access to the latest information about those in your care in a timely fashion. Similarly, if you’re waiting in line at the DMV, at a bus station, or TSA checkpoint at the airport, you want to know how long the wait is. This demands that information is provided on a real-time basis so that citizens can better plan their time. Here’s an example of how the TSA is making its data available for this use case.
A move to simplifying the interpretation of data – Data is meaningless unless we can interpret it. Maps, charts, infographics, and storytelling are making information more useful to a wider audience. For example, the Small Business Administration (SBA) uses infographics to share the vast amount of data and statistics it gathers about our nation’s largest employers – small businesses.
While there are examples of these shift in data collation and analytics across the public sector, there’s still a way to go before federal, state, and local governments become both data and information rich. Siloed systems, disparate data sources, dirty data, data fiefdoms, and a lack of knowledge about data mining, analytics, and predictive modeling, is stymying the democratization of data in government.
This month, as we focus in on big data on the blog, we’ll share insights and information about how your agency or department can overcome these challenges and leverage data as a strategic asset.


